Numbers to Know 10/22/25: The Latest on Jobs, Housing & Mortgage Rates

This is the latest in a series of videos with Windermere Principal Economist Jeff Tucker, where he delivers the key economic numbers to follow to keep you well-informed about what’s going on in the real estate market.
The government has shut down, and that means most government data publication has paused as well. The monthly CPI inflation report is delayed, and the monthly jobs report is suspended this month. So I’ll have to plan to revisit those when they resume, and in the meantime, I’ll start by checking in on the last publication out of the BLS before the shutdown: the Job Openings and Labor Turnover Survey, or JOLTS for short.
3.2%
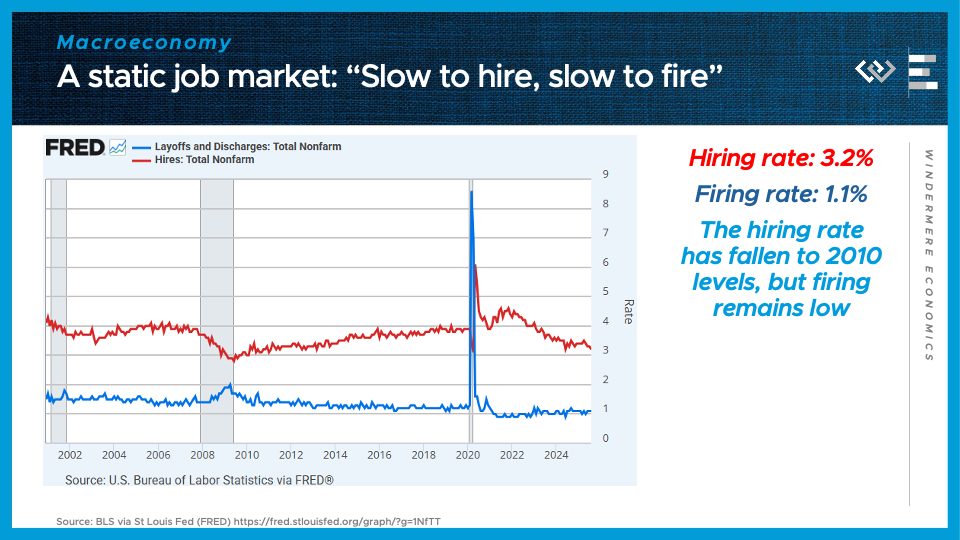
That was the hiring rate in August, meaning the share of the workforce that just got hired. It’s around the lowest hiring rate since 2010, when the economy was just beginning to dust itself off and climb out of the Great Recession. It’s one half of a simple summary of the economy that labor economists have been using for a couple years now: “Slow to hire, slow to fire.”
1.1%
That’s the rate of layoffs and discharges, or, broadly, the firing rate, to fit the rhyming scheme. It is not particularly high right now, even if it’s up slightly from the essentially record-low firing rate below 1% we saw briefly in 2022.
Putting it together, what “Slow to hire, slow to fire” means is that employers are essentially hunkering down, hanging on to their workers but not interested in growing those payrolls quickly. For people with jobs, this means the economy feels essentially OK – not great, but OK. But for those without a job, it’s proving unusually hard to break back into the workforce, which makes this a terrible time to be unemployed, and is gradually inflicting stress on the credit system and consumer spending. These are early signs of an economic slowdown, but not yet any indication of a recession.
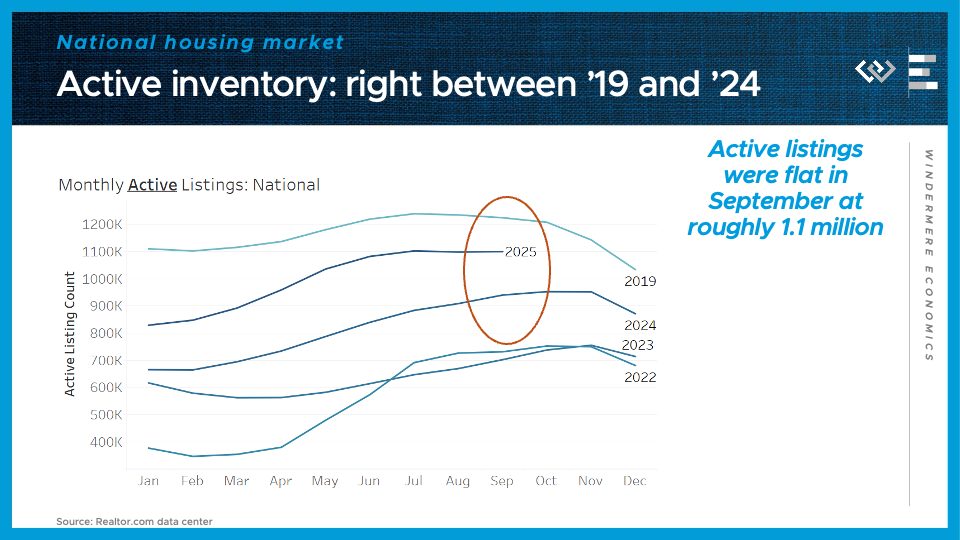
Turning to the housing market: we’ve got a familiar refrain this month. More inventory means buyers have gained more negotiating leverage, although September likely represented the high-water mark for the year, with about 1.1 million active listings for the 3rd month in a row. That’s 17% more than the same time last year.
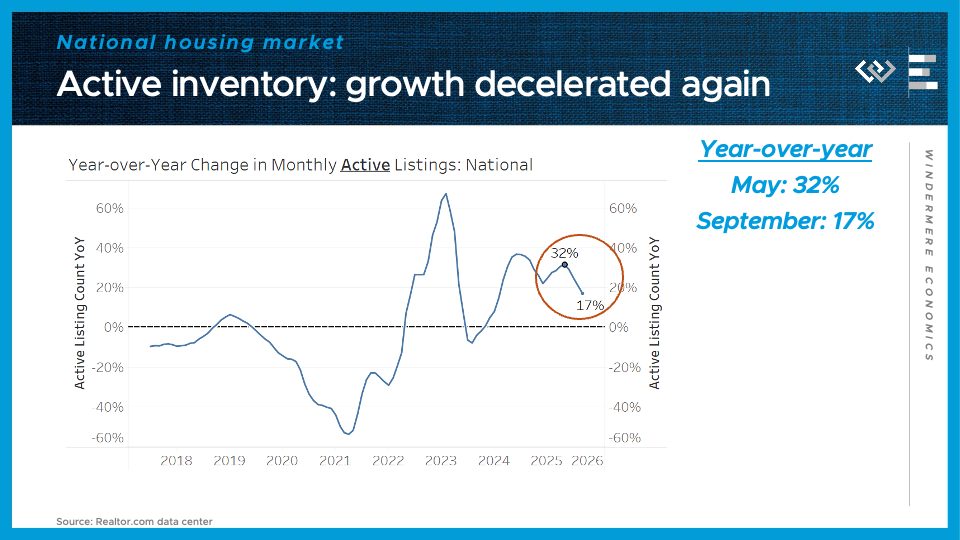
Importantly, inventory growth has passed an inflection point: for the fourth month in a row, the pace of growth of inventory has fallen yet again. Growth has now been roughly cut in half, from the 32% annual growth seen in May. That means inventory is not on a runaway growth track toward a glut that would push prices down. Rather, the market is re-equilibrating, as some sellers steer clear of a buyers’ market, or de-list after not getting a satisfactory offer. For buyers, it means conditions have moved in their favor but they shouldn’t count on that trend intensifying much further.
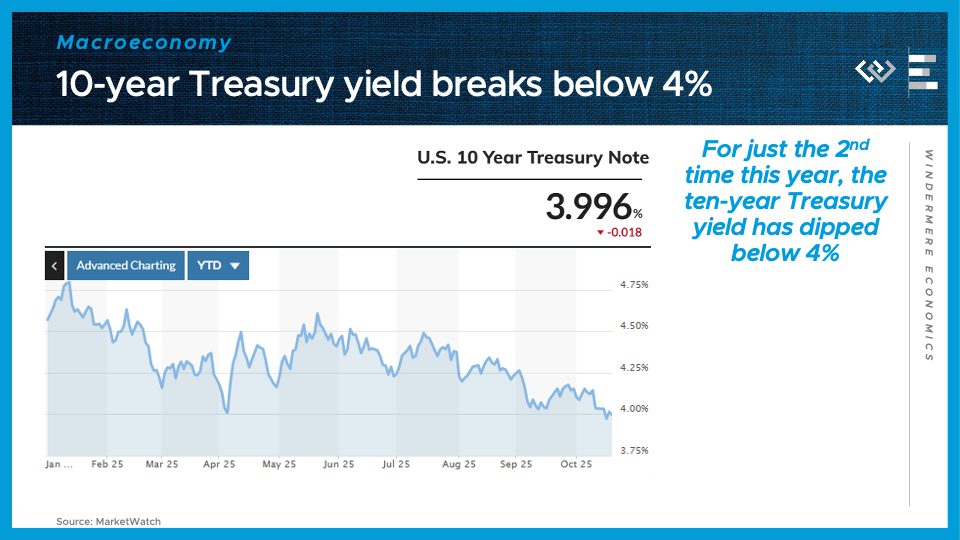
Another helpful factor for buyers, though, is that borrowing costs have continued to fall. The ten-year treasury yield, which is a major benchmark that mortgage rates tend to track, plus about 2 points, has now dipped below 4% for the first time this year. That reflects the combination of lower expected economic growth, and the resulting lower Fed Funds Rates expected over the next few years, as the Fed reacts to try to prevent a recession.
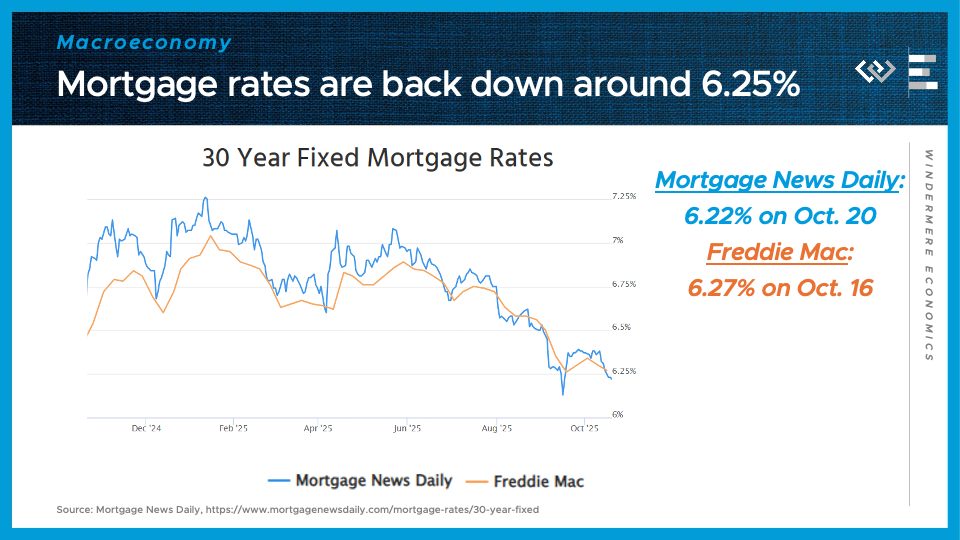
Hand in hand with those lower Treasury yields: Mortgage rates are moving back into their most favorable territory in 12 months, right around 6.25%. That represents significant savings compared to the rates of around 7% to start the year, and is partly driven by investor expectations of interest rate cuts to come. Because those expectations are already factored into the lower rates today, there’s no guarantee that mortgage rates will fall further even if and when the Fed continues cutting its overnight rate.
That is all for this month; I hope we’ll have more BLS data next month, and thanks as always for watching!

 Facebook
 X
X
 Pinterest
 Copy Link

