Local Look Western Washington Housing Update 11/6/25

Hi. I’m Jeff Tucker, principal economist at Windermere Real Estate, and this is a Local Look at the October 2025 data from the Northwest MLS.
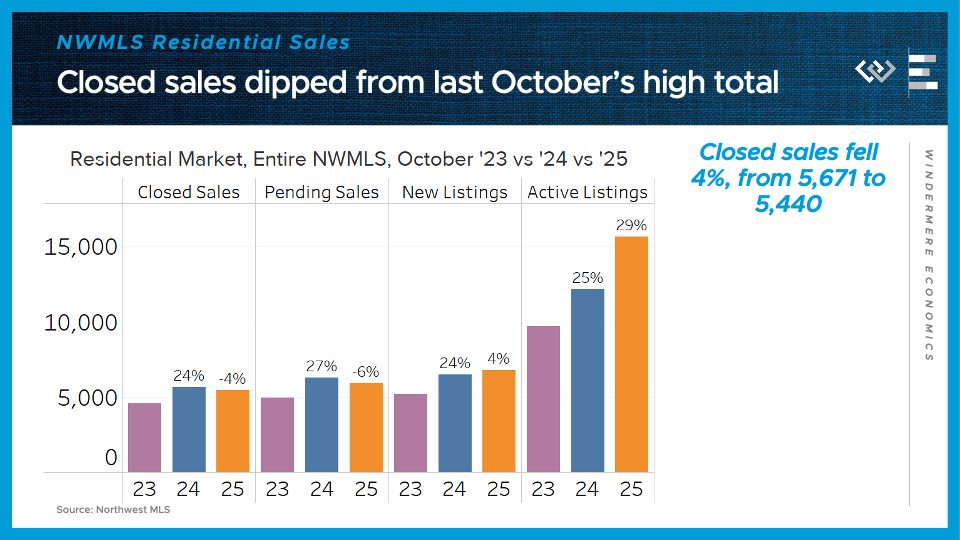
This October, the Washington housing market began its usual seasonal shift into the cooler 4th quarter. Compared to last year, it looked particularly cool, because last October saw a sudden burst of buying activity in the wake of the Fed finally beginning to cut interest rates.
Across the Northwest MLS, closed home sales came in 4% below last October’s total. MLS. Pending sales, which give some signal about next month’s sales, were down 6% from the same time last year.
On the supply side, the flow of new listings remains roughly even with last year’s, or just 4% higher. Finally, the month ended with 29% more active listings than last October, continuing a slowdown in inventory growth but still leaving buyers with more options than they had last year or the year before.
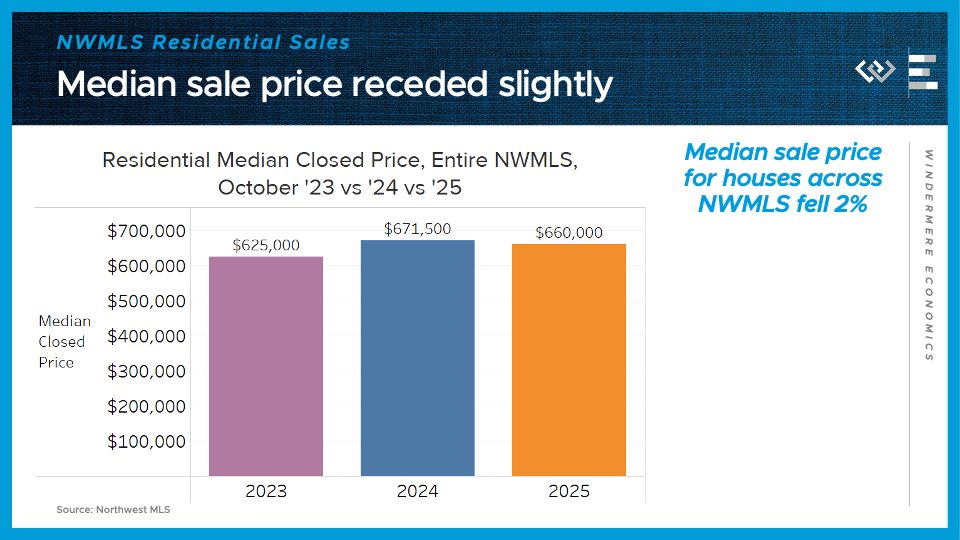
Those higher inventory levels are starting to put some downward pressure on prices, which dipped 2%, to a median of $660,000 for a residential home sale in October.
Now I’ll turn to a closer look at the four counties encompassing the greater Seattle area.
Now I’ll take a closer look at the four counties encompassing the greater Seattle area.
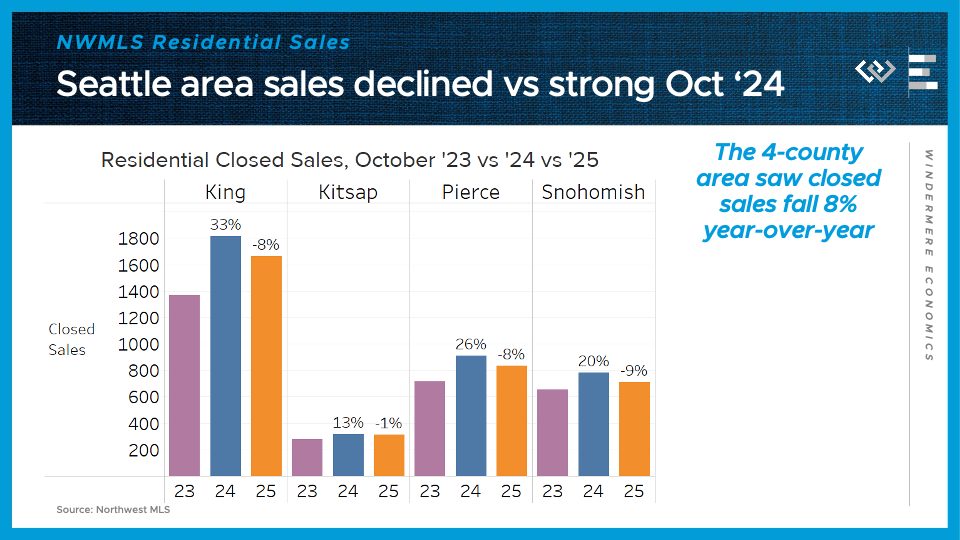
Closed sales stepped down by 8% from last October, although that month last year had unusually high sales, especially in King County, where 2024’s sales were a whopping 33% higher than in 2023.
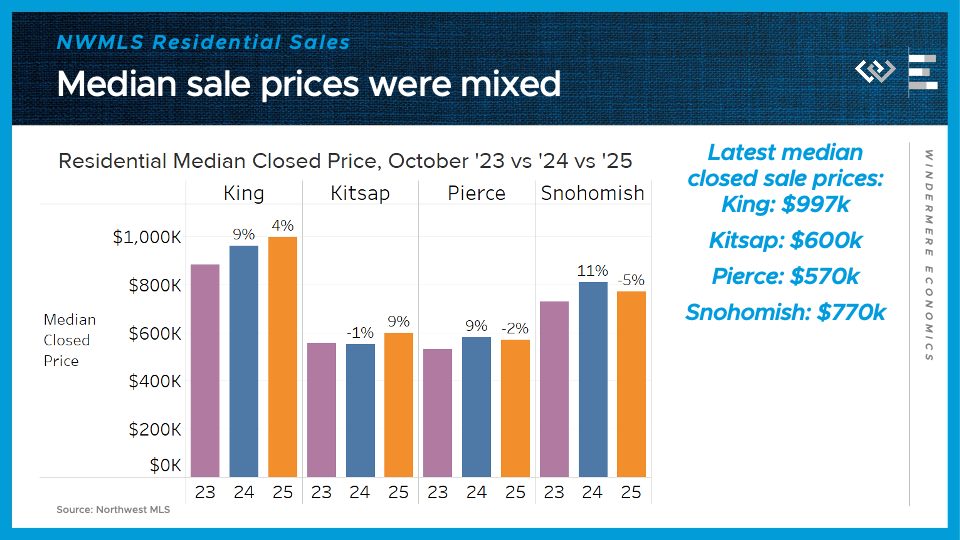
Median sale prices were split: 4% higher in King; 9% higher in Kitsap; but 2% lower in Pierce, and 5% lower in Snohomish County. That may represent a continued trend of demand retrenching toward the employment center of the region, around Seattle and Bellevue, as new return-to-office policies come into effect.
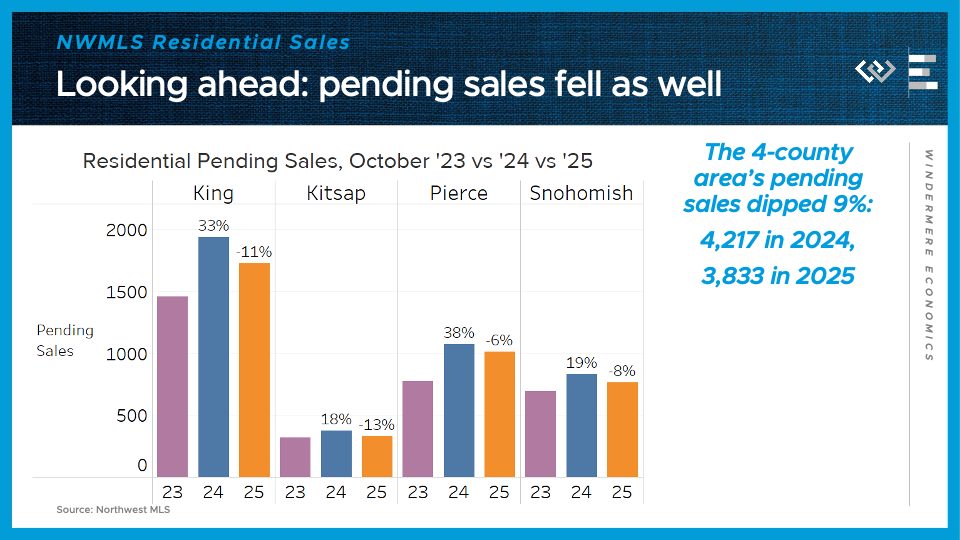
Looking ahead, pending sales fell 9% across the region, although again King County’s sales drop looks a bit like mean reversion after a standout 2024 number.
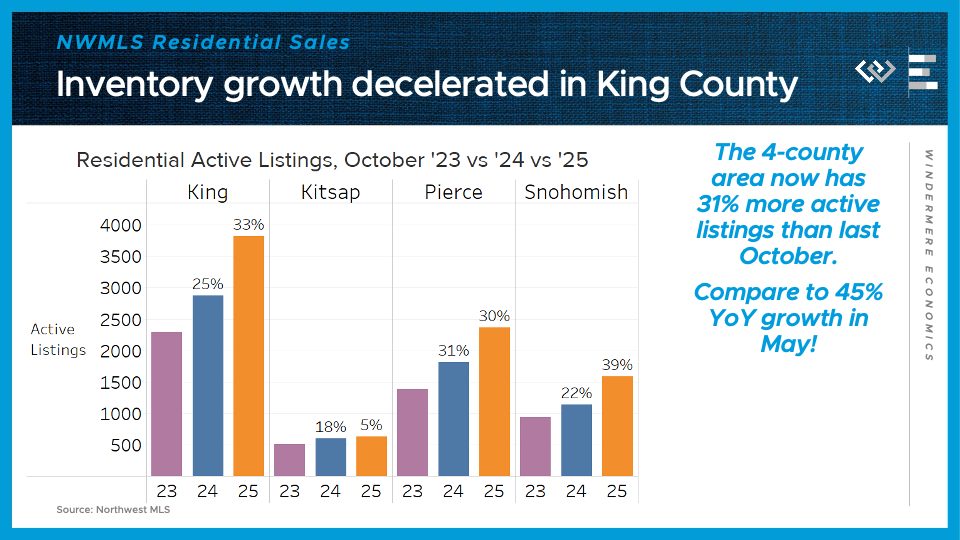
On the supply side, the 4-county greater Seattle area had 31% more active listings than at the end of October 2024. That continues the moderation of inventory growth we’ve seen since May, when this metric peaked at 45% year-over-year growth.
Looking ahead, we are entering one of the best times of the year for savvy buyers and their agents to find a bargain, and with much more inventory than even this time in the last two years. Whether they jump at the opportunity will be revealed in next month’s data!

 Facebook
 X
X
 Pinterest
 Copy Link

