Numbers to Know 8/21/25: Inventory Up, Prices Down, and Rates Easing

This is the latest in a series of videos with Windermere Principal Economist Jeff Tucker, where he delivers the key economic numbers to follow to keep you well-informed about what’s going on in the real estate market.
I’ll start this month by checking in on our most important barometer of the housing market: inventory. Active listings continued to grow in July, but at least nationally, they are still below somewhat below pre-pandemic levels for this time of year.
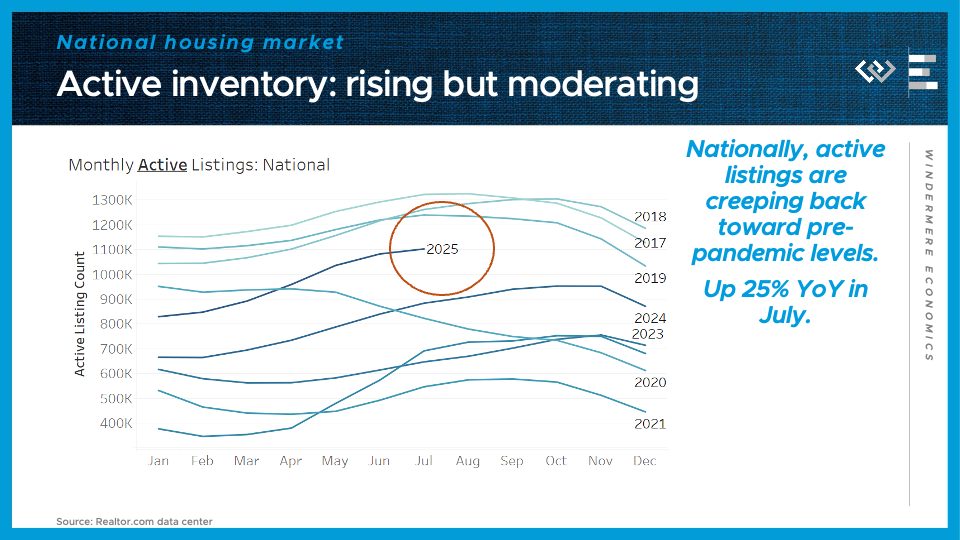
At the end of July, there were just over 1.1 million active listings on the market – below the 1.23 million on the market in July 2019, but up from 884,000 at this time last year.
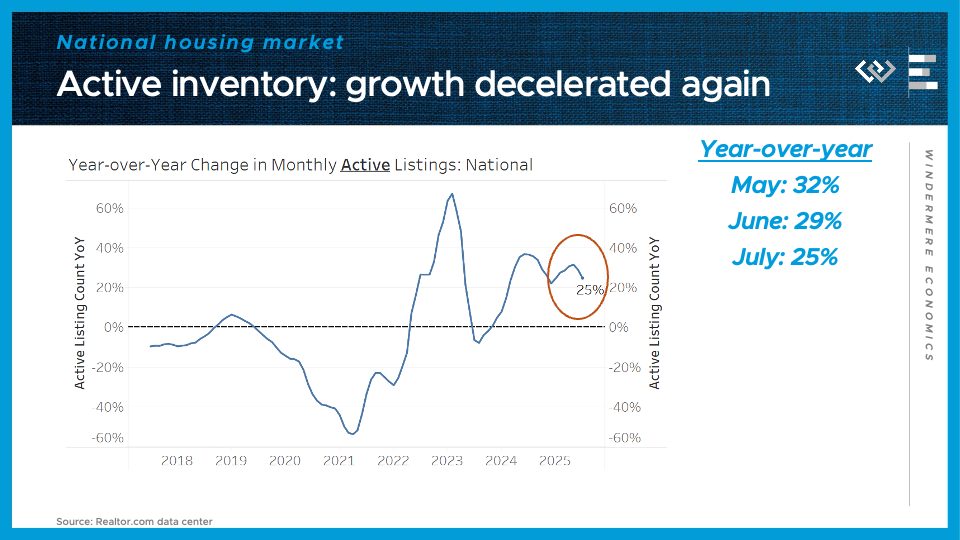
That makes for 25% year-over-year growth, which marks another month of deceleration from a peak of 32% annual growth in May. This continues to make this spring look like an inflection point, where inventory is still growing but at an ever-slower pace.
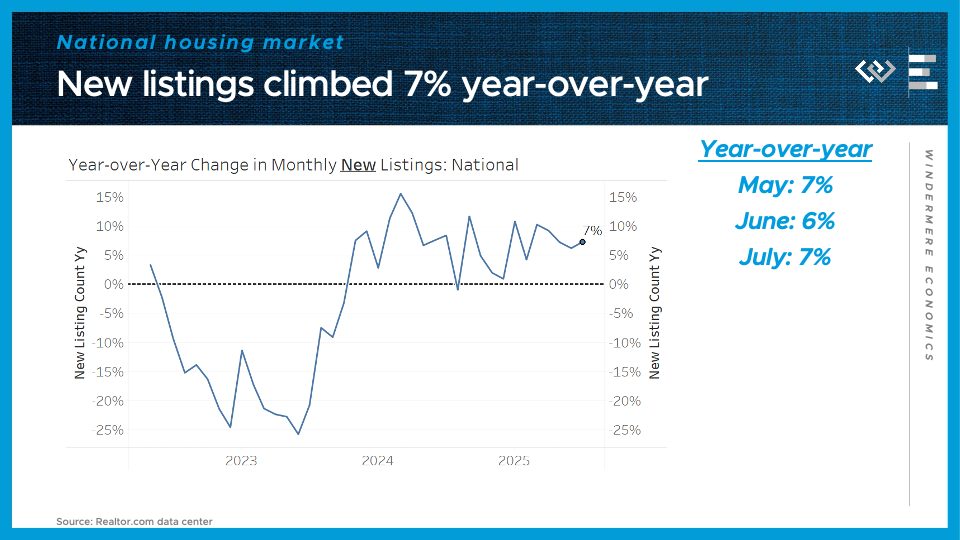
Maybe surprisingly, we didn’t see any deceleration in the flow of new listings in July – it was up 7% year-over-year, or slightly more than June’s 6%. So if inventory growth is slowing, like we just saw, it points to another rising trend this year: de-listings, or expired listings, where sellers are not getting an acceptable offer and just choosing to walk away.
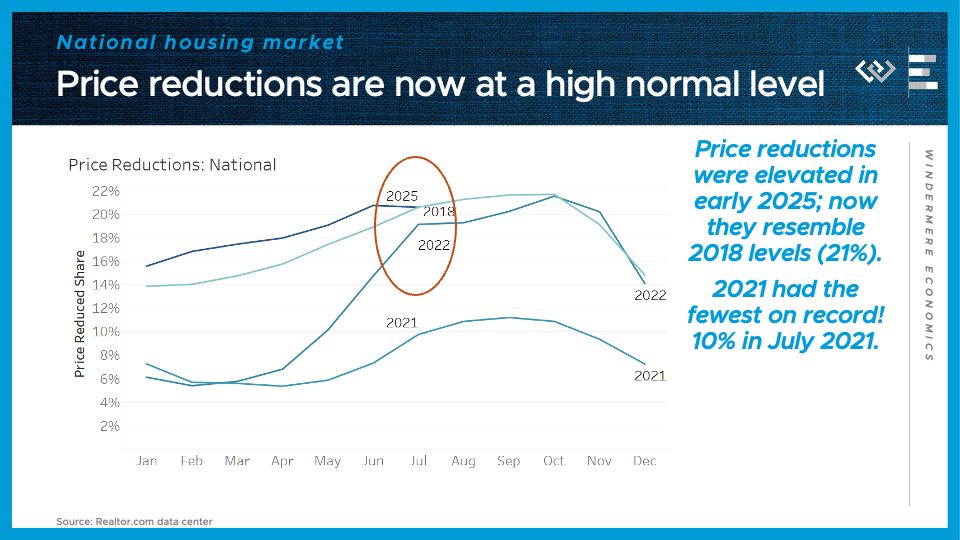
Another sign of sellers being unwilling to bend any further: price reductions. This is the share of active listings where the seller has reduced their asking price. It’s been elevated all year long, but it abruptly stopped rising in July, which is seasonally unusual — so now it’s actually at the exact same share we saw at this time in 2018, 21%, and not far from the share in July 2022.
All in all, the housing market has clearly swung in buyers’ favor, but these signs of an inflection point suggest the momentum in that direction is slowing down.
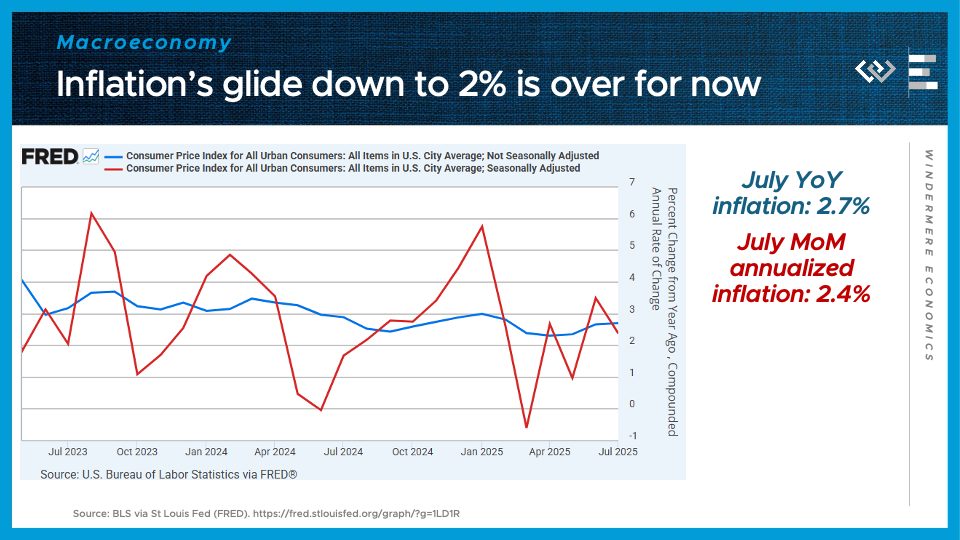
Turning to the macroeconomy, we have a couple of worrying signals of at least a mild form of macroeconomists’ least favorite condition: stagflation. Starting with the “flation” part, we see that inflation is stubbornly stuck closer to 3% than the Fed’s 2% target.
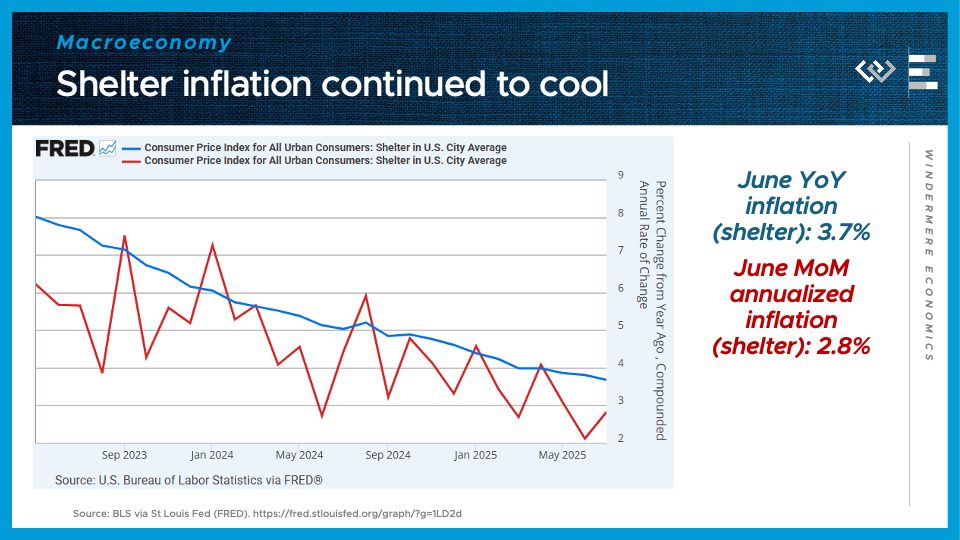
Shelter inflation has kept cooling in a kind of zigzag pattern, finally approaching 2%.

But the rest of the CPI basket, everything BUT shelter, is once again growing at – just barely – faster than 2% annualized.

And an especially predictive part of the price index, called the sticky price index less shelter, accelerated sharply to almost 3% annual growth.
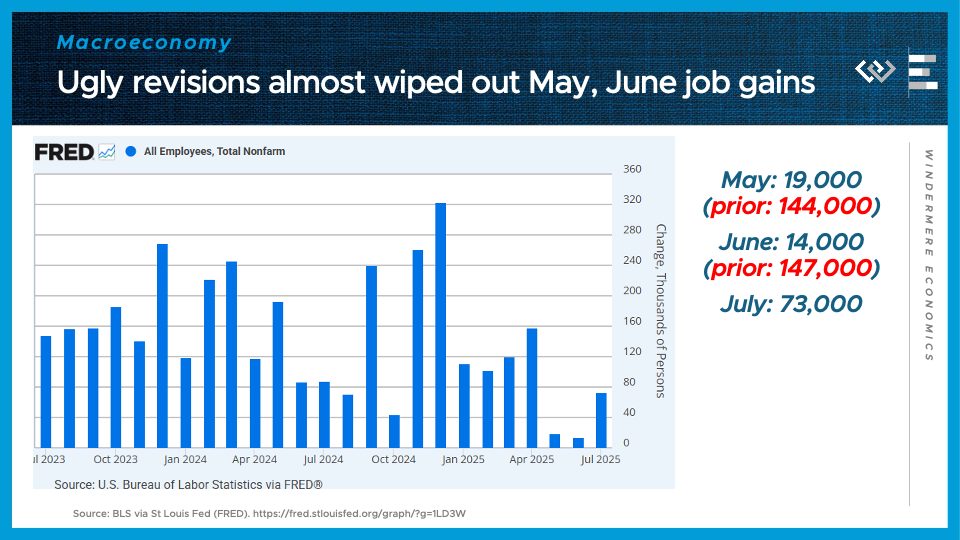
Turning to the stagnation side of things, the jobs report for July, released on August 1st, came in way below expectations. The most concerning part is that job gains for May and June were revised down radically, almost wiping out the healthy job gains the BLS reported just last month. Month-to-month revisions are a normal part of how the Bureau of Labor Statistics reports payroll gains and losses, and a pattern of sharply negative revisions often heralds the beginning of a recession.
Stagflation presents the Fed with a dilemma: the very weak jobs report would give them reason to cut interest rates, but resurgent inflation might give them pause. Markets are betting on at least one interest rate cut, starting in September, but after that it’s anybody’s guess where the data will guide their next decisions.
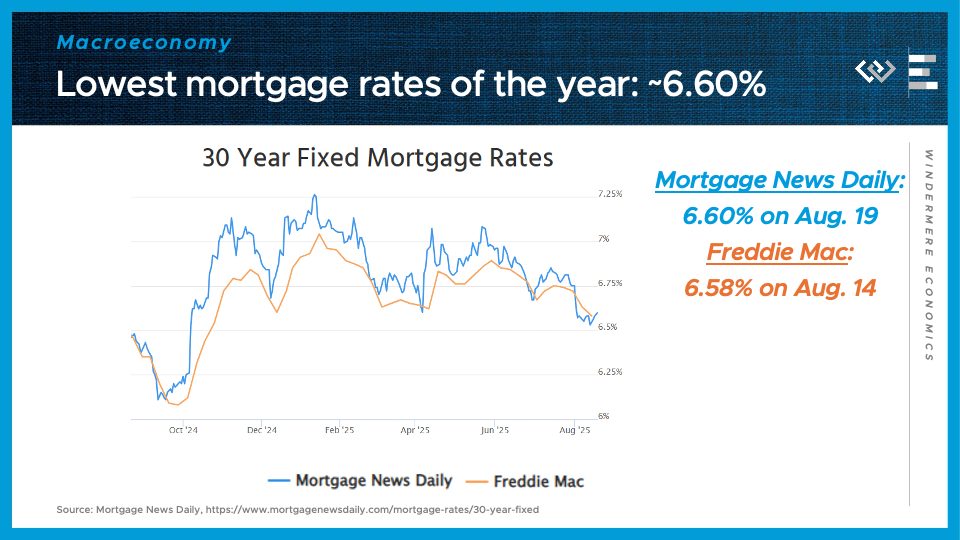
For the housing market, though, what’s most important is mortgage rates, and those have already fallen in the wake of the weak jobs report. Rates swooned, down to just over 6.5%, and while they’ve recovered slightly, this range of around 6.6% is still the best we’ve seen in 2025, so I’ll count that as progress. Buyers seem to be set up for another favorable early autumn housing market – more inventory, plenty of price reductions, and at least some mortgage rate relief.

 Facebook
 X
X
 Pinterest
 Copy Link

